运维管理21 分钟阅读
实战篇:enq: TM - contention 等待事件分析
大家好,这里是公众号 DBA学习之路,分享一些学习数据库路上的知识和经验。 @TOC目录 今天收到应用反馈:在 2025-01-03 13:30:42.058 发生了一起卡顿,持续 15 秒,到 2025-01-03 1
2025年1月15日阅读—点赞—收藏—
database
在知识库中专注阅读,并随时返回相关工具与课程
大家好,这里是公众号 DBA学习之路,分享一些学习数据库路上的知识和经验。 @TOC目录 今天收到应用反馈:在 2025-01-03 13:30:42.058 发生了一起卡顿,持续 15 秒,到 2025-01-03 1
大家好,这里是公众号 DBA学习之路,分享一些学习数据库路上的知识和经验。

本章目标:掌握本章核心知识点 前置要求:完成前序章节学习 预计时长:60 分钟
今天收到应用反馈:在 2025-01-03 13:30:42.058 发生了一起卡顿,持续 15 秒,到 2025-01-03 13:30:57.872 结束,需要帮忙排查下原因。
先介绍下数据库的环境信息:
本文记录一下我的分析过程。
首先查看问题时间段的等待事件:
1-- 查看等待事件2SQL> set line2222 pages1000 tab off3col event for a404SELECT instance_number,5 event,6 COUNT(*)7 FROM dba_hist_active_sess_history8WHERE sample_time BETWEEN to_date('2025-01-03 13:30:42',9 'yyyy-mm-dd hh24:mi:ss') AND to_date('2025-01-03 13:30:57',10 'yyyy-mm-dd hh24:mi:ss')11 GROUP BY instance_number,12 event13 ORDER BY 3 desc;1415INSTANCE_NUMBER EVENT COUNT(*)16--------------- ---------------------------------------- ----------17 1 enq: TM - contention 4218 1 log file sync 619 1 gcs drm freeze in enter server mode 220 2 gc cr block 2-way 121 1 enq: HW - contention 1可以看到在问题时间段的主要等待事件是 enq: TM - contention,发生在节点 1 上。查看节点 1 对应时间段等待事件相关 sql:
1SQL> alter session set container=<PDBNAME>;2SQL> SELECT event,3 user_id,4 sql_id,5 COUNT(*)6 FROM dba_hist_active_sess_history7 WHERE sample_time BETWEEN to_date('2025-01-03 13:30:42',8 'yyyy-mm-dd hh24:mi:ss') AND to_date('2025-01-03 13:30:57',9 'yyyy-mm-dd hh24:mi:ss')10 AND instance_number = 111 AND event = 'enq: TM - contention'12 GROUP BY user_id,13 event,14 sql_id15 ORDER BY 2;1617EVENT USER_ID SQL_ID COUNT(*)18-------------------- ---------- ------------- ----------19enq: TM - contention 112 bwf9rt5u93cpx 42等待事件对应的 SQL_ID 为 bwf9rt5u93cpx,查看具体的 SQL:
1SQL> set line2222 pages1000 tab off2col sql_text for a1003select sql_id,sql_text from gv$sql where sql_id = 'bwf9rt5u93cpx' and rownum=1; 45SQL_ID SQL_TEXT6------------- ----------------------------------------------------------------------------------------------------7bwf9rt5u93cpx update LUCIFER set .... where id=:51可以发现等待事件对应的 SQL 是一个 update DML 语句,到这我们基本已经确定问题 SQL 了,接下来就是分析为什么这个 SQL 会导致 enq: TM - contention 等待事件,以及应用卡顿的原因。
关于 enq: TM - contention 等待事件,可以参考 MOS 文档的介绍:
The 'TM' DML (Table Manipulation) Enqueue is acquired by a transaction when a table is modified by an INSERT, UPDATE, DELETE, MERGE, SELECT with the FOR UPDATE clause, or LOCK TABLE statement. DML operations require table locks to reserve DML access to the table on behalf of a transaction and to prevent DDL operations that would conflict with the transaction.
简单翻译一下:当通过 INSERT、UPDATE、DELETE、MERGE、带有 FOR UPDATE 子句的 SELECT,或 LOCK TABLE 语句修改表时,事务会获取 TM DML(表操作)队列锁。DML 操作需要表锁来为事务保留对表的 DML 访问权限,并防止与事务冲突的 DDL 操作。
一般造成 TM 锁的几种可能原因:
所以一般来说,这是一个应用程序设计问题,如果不创建缺失的 FK 索引,则无法修复。从 11.1.0.6 开始,外键锁定行为发生了变化,这是由于一个未公开的 Bug 修复的引入导致的。在修复后,对子表执行 DML 操作时,会在父表上获取 SX 模式的 DML 锁,而不是之前的 SS 模式 DML 锁。
参考 MOS 文档:
知道了导致等待事件的可能原因后,大致的排查方向就出来:
通过 SQL 检查是否存在外键
1SQL> column owner_name format a102column PARENT_TABLE format a253column key_name format a154column "referencing_table/CHILD_TABLE" format a405column foreign_key_name format a1567SELECT a.owner owner_name,8a.table_name "PARENT_TABLE",9a.constraint_name key_name,10b.table_name "referencing_table/CHILD_TABLE",11b.constraint_name foreign_key_name,12B.STATUS fk_status13FROM ALL_CONSTRAINTS a,14ALL_CONSTRAINTS b15WHERE a.constraint_name = b.r_constraint_name16AND b.constraint_type = 'R' and a.table_name='&Parent_table'17ORDER BY 1, 2, 3, 4;1819no rows selected很明显没有看到对应的记录,说明并没有外键,自然也就排除了外键索引缺失的可能。
其实这个可以直接排除,因为 update DML 的 SQL 中并没有加并行,除非在表或者索引上开启了并行度。检查表和索引是否开启并行:
1col table_name format a352col index_name format a353Rem Tables that have Indexes with not the same DOP4Rem !!!!! This command can take some time to execute !!!5Rem ---------------------------------------------------;6set lines 1507select substr(t.owner,1,15) Owner ,8t.table_name ,9substr(trim(t.degree),1,7) Degree ,10substr(trim(t.instances),1,9) Instances,11i.index_name ,12substr(trim(i.degree),1,7) Degree ,13substr(trim(i.instances),1,9) Instances14from all_indexes i,15all_tables t16where ( trim(i.degree) != trim(t.degree) or17trim(i.instances) != trim(t.instances) ) and18i.owner = t.owner and19i.table_name = t.table_name;2021no rows selected同样没有发现开启并行的情况。
分析到这,线索似乎断了。所以,问题到底出在哪了?
在付费群咨询了一下大佬,得到回复如下:
enq: TM - contention 这个等待事件,如果发生在 RAC 集群里他还有一种问题,以上分析主要是在单实例情况下。如果发生在集群中,他可是要考虑高速缓存融合问题的,需要高速缓存融合校验完成后确认无误且 GC-CR 被回收后才能释放的。
通过 awr 报告可以发现:
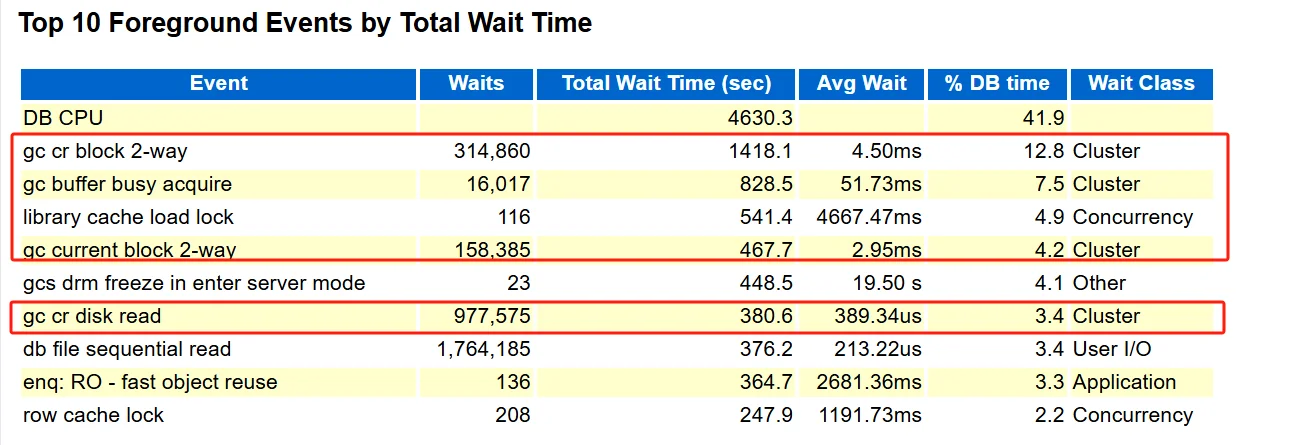
基本上所有的等待事件都指向了 GC 集群之间资源回收与高速缓存融合的问题。这个就是因为集群资源未能及时回收且集群高速缓存融合速度慢有很大的关系:
image.png
image.png 而且这集群和网络吞吐明显就高,最优方案是节点间才用更优良的网络设备。当时不是网络整体的问题,是在传输时产生了拥堵。
查看等待事件也能看到
gcs drm freeze in enter server mode等待事件的平均等待都很高,怀疑可能是 DRM 特性问题导致的 BUG。
通过 DRMDIAG 收集诊断信息:
1-- NAME: DRMDIAG.SQL2-- ------------------------------------------------------------------------3-- AUTHOR: Oracle Support Services4-- ------------------------------------------------------------------------5-- PURPOSE:6-- This script is intended to provide a user friendly guide to troubleshoot7-- drm (dynamic resource remastering) waits. The script will create a file8-- called drmdiag_<timestamp>.out in your local directory.9set echo off10set feedback off11column timecol new_value timestamp12column spool_extension new_value suffix13select to_char(sysdate,'Mondd_hh24mi') timecol,14'.out' spool_extension from sys.dual;15column output new_value dbname16select value || '_' output17from v$parameter where name = 'db_name';18spool drmdiag_&&dbname&×tamp&&suffix19set trim on20set trims on21set lines 14022set pages 10023set verify off24set feedback on2526PROMPT DRMDIAG DATA FOR &&dbname&×tamp27PROMPT Important paramenters:28PROMPT29PROMPT _gc_policy_minimum (default is 1500). Increasing this would cause DRMs to happen less frequently.30PROMPT Use the "OBJECT_POLICY_STATISTICS" section later in this report to see how active various objects are.31PROMPT32PROMPT _gc_policy_time (default to 10 (minutes)). Amount of time to evaluate policy stats. Use the33PROMPT "OBJECT_POLICY_STATISTICS" section later in this report to see how active various objects are for the34PROMPT _gc_policy_time. Usually not necessary to change this parameter.35PROMPT36PROMPT _gc_read_mostly_locking (default is TRUE). Setting this to FALSE would disable read mostly related DRMs.37PROMPT38PROMPT gcs_server_processes (default is derived from CPU count/4). May need to increase this above the39PROMPT default to add LMS processes to complte the work during a DRM but the default is usually adequate.40PROMPT41PROMPT _gc_element_percent (default is 110). May need to apply the fix for bug 14791477 and increase this to42PROMPT 140 if running out of lock elements. Usually not necessary to change this parameter.43PROMPT44PROMPT GC Related parameters set in this instance:45show parameter gc46PROMPT47PROMPT CPU count on this instance:48show parameter cpu_count4950PROMPT51PROMPT SGA INFO FOR &&dbname&×tamp52PROMPT53PROMPT Larger buffer caches (above 100 gig) may increase the cost of DRMs significantly.54set lines 12055set pages 10056column component format a40 tru57column current_size format 9999999999999999958column min_size format 9999999999999999959column max_size format 9999999999999999960column user_specified_size format 9999999999999999961select component, current_size, min_size, max_size, user_specified_size62from v$sga_dynamic_components63where current_size > 0;6465PROMPT66PROMPT ASH THRESHOLD...67PROMPT68PROMPT This will be the threshold in milliseconds for total drm freeze69PROMPT times. This will be used for the next queries to look for the worst70PROMPT 'drm freeze' minutes. Any minutes that have an average log file71PROMPT sync time greater than the threshold will be analyzed further.72column threshold_in_ms new_value threshold format 999999999.99973select decode(min(threshold_in_ms),null,0,min(threshold_in_ms)) threshold_in_ms74from (select inst_id, to_char(sample_time,'Mondd_hh24mi') minute,75sum(time_waited)/1000 threshold_in_ms76from gv$active_session_history77where event like '%drm freeze%'78group by inst_id,to_char(sample_time,'Mondd_hh24mi')79order by 3 desc)80where rownum <= 10;8182PROMPT83PROMPT ASH WORST MINUTES FOR DRM FREEZE WAITS:84PROMPT85PROMPT APPROACH: These are the minutes where the avg drm freeze time86PROMPT was the highest (in milliseconds).87column event format a30 tru88column program format a35 tru89column total_wait_time format 999999999999.99990column avg_time_waited format 999999999999.99991select to_char(sample_time,'Mondd_hh24mi') minute, inst_id, event,92sum(time_waited)/1000 TOTAL_WAIT_TIME , count(*) WAITS,93avg(time_waited)/1000 AVG_TIME_WAITED94from gv$active_session_history95where event like '%drm freeze%'96group by to_char(sample_time,'Mondd_hh24mi'), inst_id, event97having sum(time_waited)/1000 > &&threshold98order by 1,2;99100PROMPT101PROMPT ASH DRM BACKGROUND PROCESS WAITS DURING WORST MINUTES:102PROMPT103PROMPT APPROACH: What are LMS and RS/RMV doing when 'drm freeze' waits104PROMPT are happening? LMD and LMON info may also be relevant105column inst format 999106column minute format a12 tru107column event format a50 tru108column program format a55 wra109select to_char(sample_time,'Mondd_hh24mi') minute, inst_id inst,110sum(time_waited)/1000 TOTAL_WAIT_TIME , count(*) WAITS,111avg(time_waited)/1000 AVG_TIME_WAITED,112program, event113from gv$active_session_history114where to_char(sample_time,'Mondd_hh24mi') in (select to_char(sample_time,'Mondd_hh24mi')115from gv$active_session_history116where event like '%drm freeze%'117group by to_char(sample_time,'Mondd_hh24mi'), inst_id118having sum(time_waited)/1000 > &&threshold and sum(time_waited)/1000 > 0.5)119and (program like '%LMS%' or program like '%RS0%' or program like '%RMV%'120or program like '%LMD%' or program like '%LMON%' or event like '%drm freeze%')121group by to_char(sample_time,'Mondd_hh24mi'), inst_id, program, event122order by 1,2,3,5 desc, 4;123124PROMPT125PROMPT POLICY HISTORY INFO:126PROMPT See if you can correlate policy history events with minutes of high127PROMPT wait time.128select * from gv$policy_history129order by event_date;130PROMPT131PROMPT DYNAMIC_REMASTER_STATS132PROMPT This shows where time is spent during DRM operations.133set heading off134set lines 60135select 'Instance: '||inst_id inst, 'Remaster Ops: '||remaster_ops rops,136'Remaster Time: '||remaster_time rtime, 'Remastered Objects: '||remastered_objects robjs,137'Quiesce Time: '||quiesce_time qtime, 'Freeze Time: '||freeze_time ftime,138'Cleanup Time: '||cleanup_time ctime, 'Replay Time: '||replay_time rptime,139'Fixwrite Time: '||fixwrite_time fwtime, 'Sync Time: '||sync_time stime,140'Resources Cleaned: '||resources_cleaned rclean,141'Replayed Locks Sent: '||replayed_locks_sent rlockss,142'Replayed Locks Received: '||replayed_locks_received rlocksr,143'Current Objects: '||current_objects144from gv$dynamic_remaster_stats145order by 1;146set lines 120147set heading on148149PROMPT150PROMPT OBJECT_POLICY_STATISTICS:151PROMPT The sum of the last 3 columns (sopens,xopens,xfers) decides whether the object152PROMPT will be considered for DRM (_gc_policy_minimum). The duration of the stats153PROMPT are controlled by _gc_policy_time (default is 10 minutes).154select object,node,sopens,xopens,xfers from x$object_policy_statistics;155156PROMPT157PROMPT ACTIVE OBJECTS (OBJECT_POLICY_STATISTICS)158PROMPT These are the objects that are above the default _gc_policy_minimum (1500).159select object, node, sopens+xopens+xfers activity160from x$object_policy_statistics161where sopens+xopens+xfers > 1500162order by 3 desc;163164PROMPT LWM FOR LE FREELIST165PROMPT This number should never get near zero, if it does consider the fix for bug 14791477166PROMPT and/or increasing _gc_element_percent.167select sum(lwm) from x$kclfx;168169PROMPT170PROMPT GCSPFMASTER INFO WITH OBJECT NAMES171column objname format a120 tru172select o.name || ' - '|| o.subname objname, o.type#, h.*173from v$gcspfmaster_info h, obj$ o where h.data_object_id=o.dataobj#174order by data_object_id;175176PROMPT177PROMPT ASH DETAILS FOR WORST MINUTES:178PROMPT179PROMPT APPROACH: If you cannot determine the problem from the data180PROMPT above, you may need to look at the details of what each session181PROMPT is doing during each 'bad' snap. Most likely you will want to182PROMPT note the times of the high drm freeze waits, look at what183PROMPT LMS, RS, RMV, LMD0, LMON is doing at those times, and go from there...184set lines 140185column program format a45 wra186column sample_time format a25 tru187column event format a30 tru188column time_waited format 999999.999189column p1 format a40 tru190column p2 format a40 tru191column p3 format a40 tru192select sample_time, inst_id inst, session_id, program, event, time_waited/1000 TIME_WAITED,193p1text||': '||p1 p1,p2text||': '||p2 p2,p3text||': '||p3 p3194from gv$active_session_history195where to_char(sample_time,'Mondd_hh24mi') in (select196to_char(sample_time,'Mondd_hh24mi')197from gv$active_session_history198where event like '%drm freeze%'199group by to_char(sample_time,'Mondd_hh24mi'), inst_id200having sum(time_waited)/1000 > &&threshold)201and time_waited > 0.5202order by 1,2,3,4,5;203204spool off205206PROMPT207PROMPT OUTPUT FILE IS: drmdiag_&&dbname&×tamp&&suffix208PROMPT根据输出内容发现,确实存在问题:
1ASH WORST MINUTES FOR DRM FREEZE WAITS:23APPROACH: These are the minutes where the avg drm freeze time4was the highest (in milliseconds).56MINUTE INST_ID EVENT TOTAL_WAIT_TIME WAITS AVG_TIME_WAITED7------------------- ---------- ------------------------------ ----------------- ---------- -----------------8Sep25_2142 2 gcs drm freeze in enter server 114534.611 89 1286.9069Sep25_2321 2 gcs drm freeze in enter server 108782.598 117 929.76610Sep26_1312 1 gcs drm freeze in enter server 90174.892 81 1113.27011Sep26_1442 1 gcs drm freeze in enter server 168819.711 178 948.42512Sep26_1522 2 gcs drm freeze in enter server 128503.922 126 1019.87213Sep26_1622 2 gcs drm freeze in enter server 99923.706 98 1019.63014Sep26_2023 1 gcs drm freeze in enter server 200035.622 192 1041.85215Sep26_2024 1 gcs drm freeze in enter server 98015.416 64 1531.49116Sep26_2324 1 gcs drm freeze in enter server 134652.836 77 1748.738查了下 MOS 文档:
查看对应的问题描述:
Beginning with the LSR (lock state resolution) feature introduced in 19c, it is possible to >see "gcs drm freeze in enter server mode" waits when there is no DRM running. These could be triggered by a new feature called LSR which tries to resolve long GC waits. There are a few wait chains like this: Chain 1 Signature: 'rdbms ipc message'<='gcs drm >freeze in enter server mode'<='gc cr request'
针对 19.19 版本的 BUG 只有这个,临时解决方案是:
1SQL> alter system set "_gcs_recoverable_asserts"=0 scope=both sid='*';23System altered.最终解决方案是升级到 19.22 以上。
本文仅分享问题分析思路,问题是否解决还得观察,暂且不表,如果进展,我再更新,收!